

Author:
(1) Laurence Francis Lacey, Lacey Solutions Ltd, Skerries, County Dublin, Ireland.
Editor's Note: This is Part 2 of 7 of a study on how changes in the money supply, economic growth, and savings levels affect inflation. Read the rest below.
Table of Links
- Abstract and 1 Introduction
-
- Methods
- 2.1 Statistical Methodology
- 2.2 US Time Series Data
- 2.3 Hyperinflation Model
-
- Results
- 3.1 Characterisation of Price Inflation
- 3.2 Characterisation of Hyperinflation in the Weimar Republic (1922 to 1923)
- 4. Discussion
- 5. Conclusion, Supplementary materials, Acknowledgements, and References
- Appendix
2.1 Statistical Methodology
An information entropy statistical methodology has been developed for investigating expansionary processes, in with full details of the methodology can be found [5,6,7]. For an exponential expansionary process, the methodology provides a rate-constant (λ) for the exponential growth of the process (G(t)) and the associated information entropy for the time series under investigation [5,7]. This can be expressed as follows:
G(t) = exp(λ 𝑥 t)
and,
Info Ent (G(t)) = λ 𝑥 t
While information entropy has no units, at any given time, it is related to the average growth rate (𝑟), where:
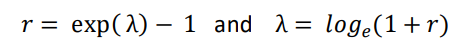
Consequently, the information entropy of an expansionary process can be considered to be related to the “velocity” of the growth of a time series of values [5,7]. Henceforth, in the interests of nomenclature brevity, the following nomenclature will be adopted:
vG(t) = Info Ent (G(t))
where, v relates to the “velocity” of growth of any given time series, G(t).
The hypothesis that this paper will investigate, for the US time series over the period 2001 to 2019, is:
𝑣𝐶𝑃𝐼(𝑡) = 𝑣𝐵𝑀𝑆(𝑡) − 𝑣𝐺𝐷𝑃(𝑡) − 𝑣𝑆𝐴𝑉(𝑡)
where CPI is the consumer price index, BMS is the broad money supply, and SAV are average savings.
This paper is available on arxiv under CC BY-NC-ND 4.0 DEED license.